Solar canopy decisions
What Should a Solar Carport Energy Display Show?
Make solar carport dashboards understandable by distinguishing power, energy, estimates, data freshness and renewable electricity claims.
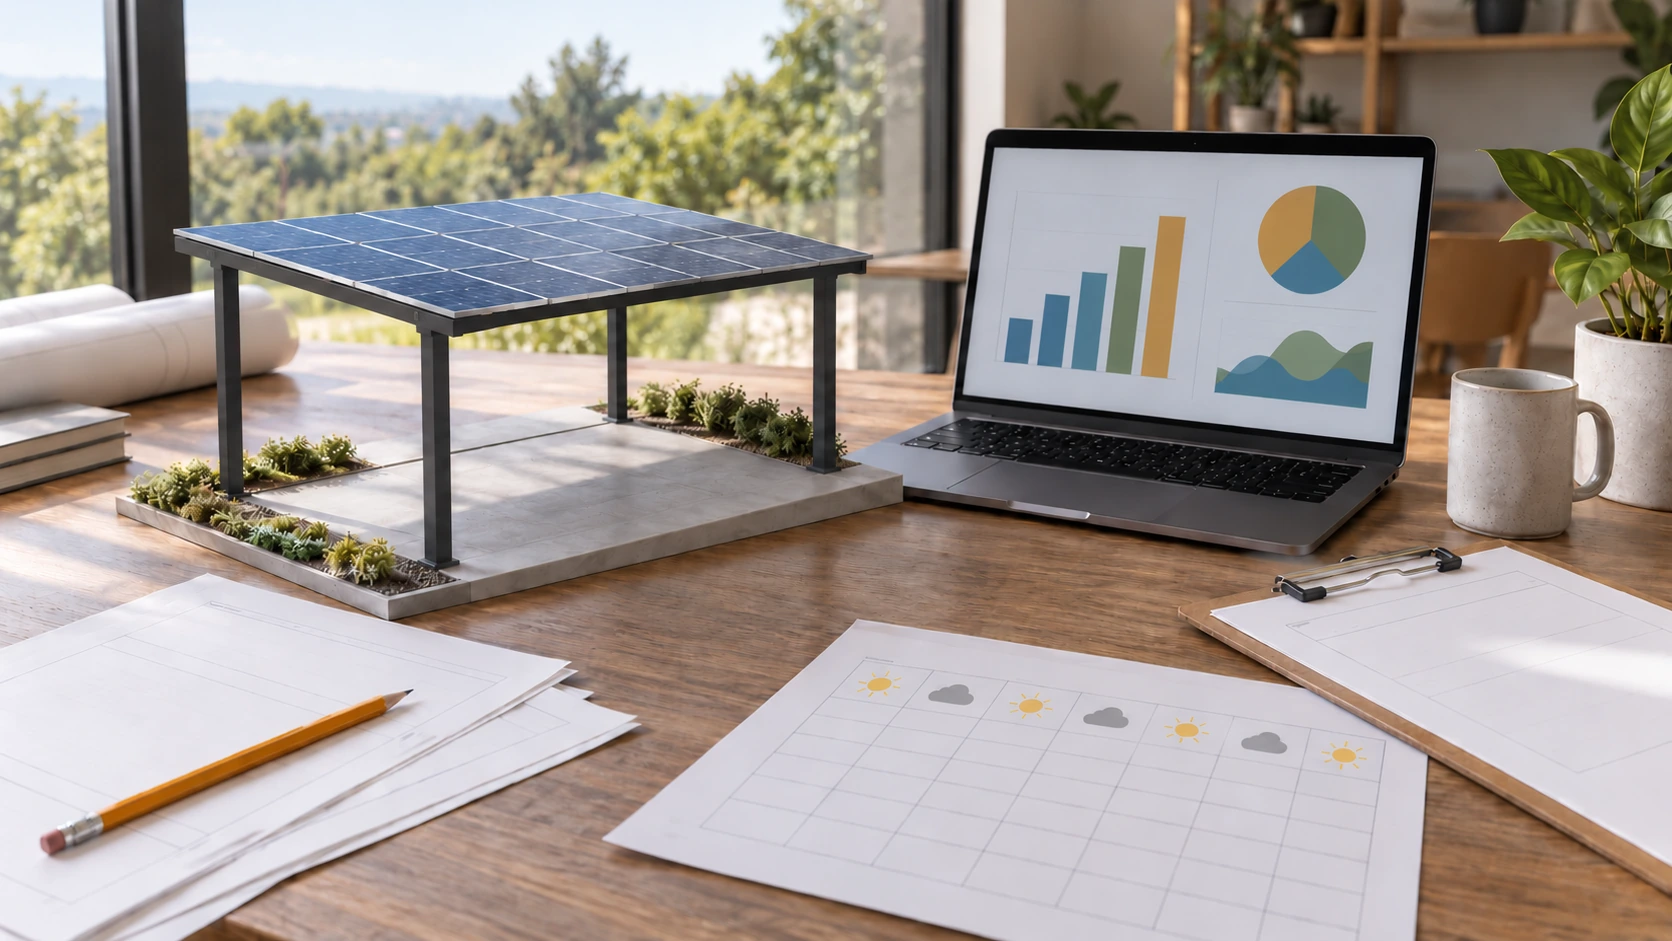
Explain what each number represents
A display can help visitors understand a solar carport when each number has a clear meaning. Power describes a rate at a moment; energy describes production over a period. They should not share an ambiguous label. Identify whether data comes from an inverter, separate meter or model, and whether it covers one canopy or a whole campus. If charging consumption and solar generation have different boundaries, label them separately. Adjacent figures should not imply entirely direct solar charging. Define metrics before choosing large numbers and animations.
Distinguish estimates from measurements
Planning estimates and operating measurements serve different purposes and must retain their identities. PVWatts estimates depend on location, system inputs and weather assumptions; outputs are not measured generation already achieved on site. When showing forecasts alongside actual values, state the period, input version and missing data. Dividing annual estimates into identical daily targets can incorrectly make a cloudy day look like equipment failure. The public view may be simple, but retain metric definitions and sources behind it so managers can explain why values change.
- Label power or energy, units and periods.
- Distinguish measured, estimated and cumulative values.
- Show the last update and missing-data status.
Do not turn a data outage into zero generation
Imagine a school display retaining the last sunny reading after its network connection fails. Visitors may read it as current output; replacing it with zero could instead suggest a plant shutdown. Show unavailable data and the last update, directing technical alerts to the management interface. Genuine night-time zero output and a communications fault should have different states. Check time zones and daily rollovers to avoid duplicated or missing totals around midnight. This example concerns display behavior, not a claim about features of a particular monitoring platform.
Explain environmental claims carefully
If avoided emissions are estimated, disclose the conversion basis, region, period and method rather than presenting the result as directly measured emissions. Solar-use claims may also depend on ownership of energy attributes. EPA guidance discusses solar claims and renewable energy certificates in the US market; other jurisdictions require their own review. Keep dashboard, website and procurement wording consistent, without converting an estimate into a guarantee elsewhere. Facilities and communications staff should approve definitions, retain versions and update explanations when meters, equipment or contracts change.
Can cumulative generation simply be relabelled as emissions avoided?
No. Generation is energy data; avoided emissions usually require a region- and method-specific conversion and should be labelled as an estimate. Renewable electricity claims may involve energy attribute ownership. Check boundaries, data quality and local rules before publishing metrics.
More questions, practical answers →